Dashboards people trust: what we learned redesigning operational screens.
We studied how operators actually use the dashboards we design. The screens they trust are not the ones with the most data. They are the ones that hide the right things.

A dashboard is a promise: look here and you will know what is happening. Most dashboards break that promise, not because the data is wrong, but because nobody can find the one number that matters among the forty that do not.
Over the past two years our data visualisation team has redesigned operational screens for logistics, energy, finance and manufacturing clients. For this report we revisited those projects and the observation sessions behind them: hours spent watching operators, analysts and managers use dashboards in their real working day. These are the patterns that came up again and again.
What we found
1. People look for exceptions, not totals
Almost nobody we observed read a dashboard top to bottom. They scanned for something unusual: a red tile, a line that jumped, a number that did not look right. Screens that made exceptions obvious were used constantly. Screens that showed everything at the same volume were opened, glanced at and closed.
2. Trust depends on knowing how fresh the data is
The single most common question operators asked aloud was some version of ‘is this live?’ When a screen did not say when its data was last updated, people checked a second system to be sure, which defeated the purpose of the dashboard.
3. Colour is overused and underplanned
Many of the dashboards we inherited used colour for decoration, branding and status all at once. Operators could not tell whether green meant good, selected or simply part of the brand palette. Reserving strong colour for status alone made screens calmer and faster to read.
4. Every extra chart costs attention
Teams often add charts because the data exists. Each addition seems free; together they bury the signal. When we removed the least-used panels in testing, people found answers faster and rated the screens as more complete, not less.
The best dashboard is the one that lets you stop looking at it.
Design principles that came out of the work
- Lead with the exception: surface what needs attention first, and let normal fade back.
- Show freshness everywhere: a clear timestamp or live indicator on every panel.
- Keep colour for meaning: one consistent scale for status, never borrowed for decoration.
- One question per panel: if a chart answers two questions, split it or cut one.
- Make the next step obvious: every alert should lead directly to the place where it can be fixed.
Patterns that worked
- A single headline status for the whole operation, readable from across a room.
- Small multiples instead of one crowded chart, so trends can be compared at a glance.
- Plain-language summaries next to charts: ‘Three shipments delayed at Rotterdam’.
- An activity feed of recent changes, so people can see what happened while they were away.
- Dark interfaces for control rooms, light ones for offices, with the same colour meanings in both.
These principles shaped our command view for an international logistics group, where eleven separate tools became one screen and exceptions are now spotted in minutes instead of hours.
Where AI agents fit
More operational systems now include software agents that act on their own: rerouting shipments, rebalancing loads, flagging fraud. This makes dashboards more important, not less. People need to see what the agents did, why they did it and how to step in. In our recent projects, a clear record of agent actions, with the reason for each, did more for trust than any accuracy figure.
How we redesign a dashboard
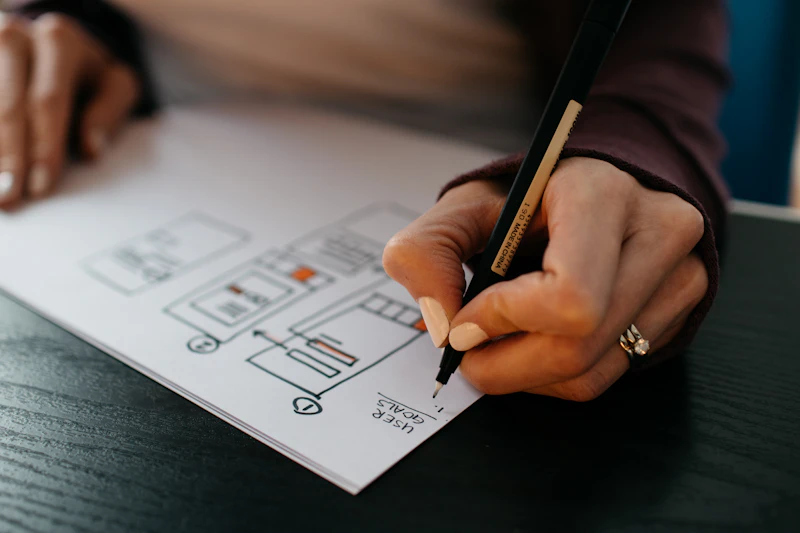
Our process starts away from the screen. We sit with the people who use the dashboard, ask them what decisions they make in a shift and note which numbers they actually look at. Only then do we sketch. The first version is usually built with real data rather than placeholder figures, because fake data hides the awkward cases: the long name, the missing value, the sudden spike. We test that version in the real setting, on the real screens, and cut anything nobody used.
Questions to ask of your own dashboards
- Can a new team member find the most important number within five seconds?
- Does every panel say how fresh its data is?
- Does each colour mean exactly one thing?
- Which panels have not been looked at in a month, and why are they still there?
- When something goes wrong, does the screen show what to do next?
About this research
Findings are drawn from observation sessions, interviews and usage data gathered during our own dashboard projects between 2024 and 2026, across four sectors. We report patterns rather than precise figures because the projects differed in size and setting. We will keep adding to this work as new projects complete.